SmogWatch – WiFi enabled smog meter
Napisano dnia 25.01.2019 r. o godzinie 20:52
Autor: Piotr Sperka
Introduction
Recently, just before the end of 2018, I got interested in cheap air quality sensors. In the short term, it has resulted in a device that allows the measurement of air quality, as well as temperature, humidity and atmospheric pressure. As I don’t have a lot of free time, I decided to implement the device in the form of a weekend (or two) project, consisting largely of available modules. This allows the device to be build by almost anyone who has basic tools and some basic electronics skills.
Design
After quickly reviewing the commercially available modules, I decided to base my device on a well-known ESP8266 (ESP-12) module, as well as few sensors:
- PMS5003 for air quality measurement; It allows you to measure PM-10, PM-2.5 and PM-1.0 air dust particles.
- DHT22 for humidity measurement.
- BMP280 for atmospheric pressure and air temperature measurement.
The air quality sensor communicates through UART, the BMP280 uses I²C, and the DTH22 uses a protocol, which is somehow similar to 1-Wire. Since the ESP8266 uses its hardware UART for programming, to control the PMS5003 sensor I decided to use software UART. After a brief analysis of available ESP’s GPIO, I came to the following wiring diagram:
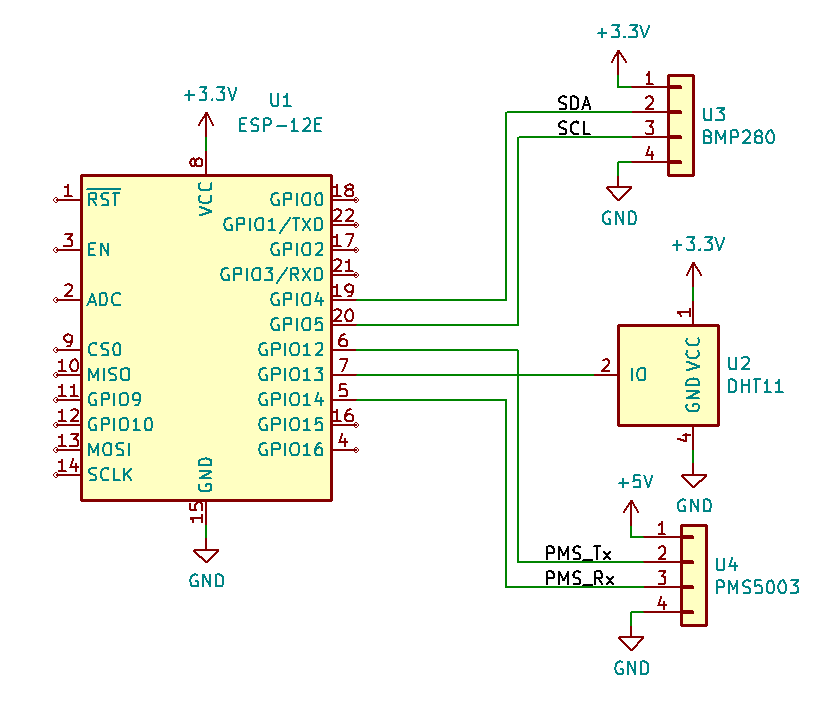
SmogWatch – Schematic
To power the device I decided to use a 12V plug adapter and a converter module based on the LM2596 clone, which produces the 5V needed to power the PMS5003. To power the remaining components, I used the voltage of 3.3V, which is provided by the LD1117 stabilizer soldered on the PCB which also holds ESP-12. An important note for all those who would like to duplicate this layout: you need to verify the connections on the PCB, because mine was designed for other (less common) stabilizer with different pinout. But it was nothing that could not be fixed with small knife and a wire.

SmogWatch – Prototype
Software
Since designed device was not intended to be a commercial solution, but only a weekend project, I decided to make the job much easier and use… Arduino for ESP8266. In truth, I was surprised that such a thing exists. For me, Arduino was always associated with AVR microcontrollers. However, such a thing not only exists, but as it turned out, it works quite efficiently and effectively. Its great advantage are also available libraries (among the others, for all sensors that I’ve used).
Sensors
For controlling all the sensors, I’ve used following Arduino libraries:
- DHTStable for DHT22
- Adafruit BMP280 Library for BMP280
- PMS Library for PMS5003 along with EspSoftwareSerial to support software serial port (UART)
NTP client
I thought it would be good to save time stamp when the data from a particular sensor was updated. It is important, because data from air quality sensor is collected less frequently than from the others. But there was a problem: how do I get the current time? Since the ESP8266 does not have a clock with battery backup (or any other dedicated RTC clock), I’ve decided to use millisecond timer available in Arduino (millis() function), synchronized hourly to the NTP time server. After a brief research it turned out that NTP works based on the UDP protocol, and it is pretty easy to use. For those interested in some deatils, the time routines are implemented in the getTimeFromNtp() function.
Communication with the database
I decided that the sensor data will be stored in the database on remote server. This is convenient for several reasons, for example I will have the data history stored and also I will have the possibility to show the live data online. To simplify the task of sending data from ESP to the server, I’ve created a script in PHP. This script authenticates the query with the password and gets the data to be stored in JSON format. ESP’s only task is to collect data, create JSON and send it along with the password to the server using POST. The rest, i.e. parsing data and placing it in the MySQL database is made on the server side.
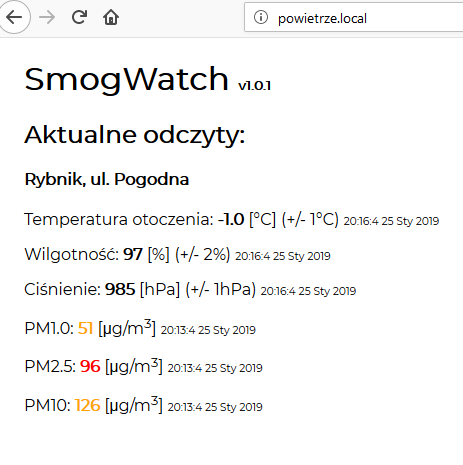
SmogWatch – View of measurements directly from the device
User interface
The data can be presented to user in two ways. The first is to connect through web browser to the device. However, it has some drawbacks – only the last reading is presented, and in most cases, the device can only be accessed from local network. That’s why I’ve also created a really simple website, that shows data stored in MySQL database. Backend is also created using PHP. It gets data from database, makes some calculations and returns JSON, which is used by JavaScript in frontend.
Other functions
The first problem you come across when you start the (blank) device is entering the WiFi credentials. To avoid hard-coding credentials or having to connect via UART, I’ve used the WifiManager library. This library tries to connect to the last saved network. If the device has blank configuration memory, or the connection wasn’t successful, the device switches to the WiFi AP mode. Then you just need to connect to it, for example using a smartphone (or any other device with WiFi) and select your WiFi name and credentials. The device will reset and connect to selected network. To make it easier to update the firmware in the device, I’ve used the ESP8266HTTPUpdateServer module to enable OTA updates. Additionally, the device also runs a MDNS server. On a compatible device (on Windows you need to install Bonjour) just go to the powietrze.local address and you will get to the device’s web interface.
Overall, apart from those mentioned earlier, I’ve used following libraries:
- ArduinoHttpClient for easy interaction with server-side API using sockets.
- WifiManager for easy WiFi configuration.
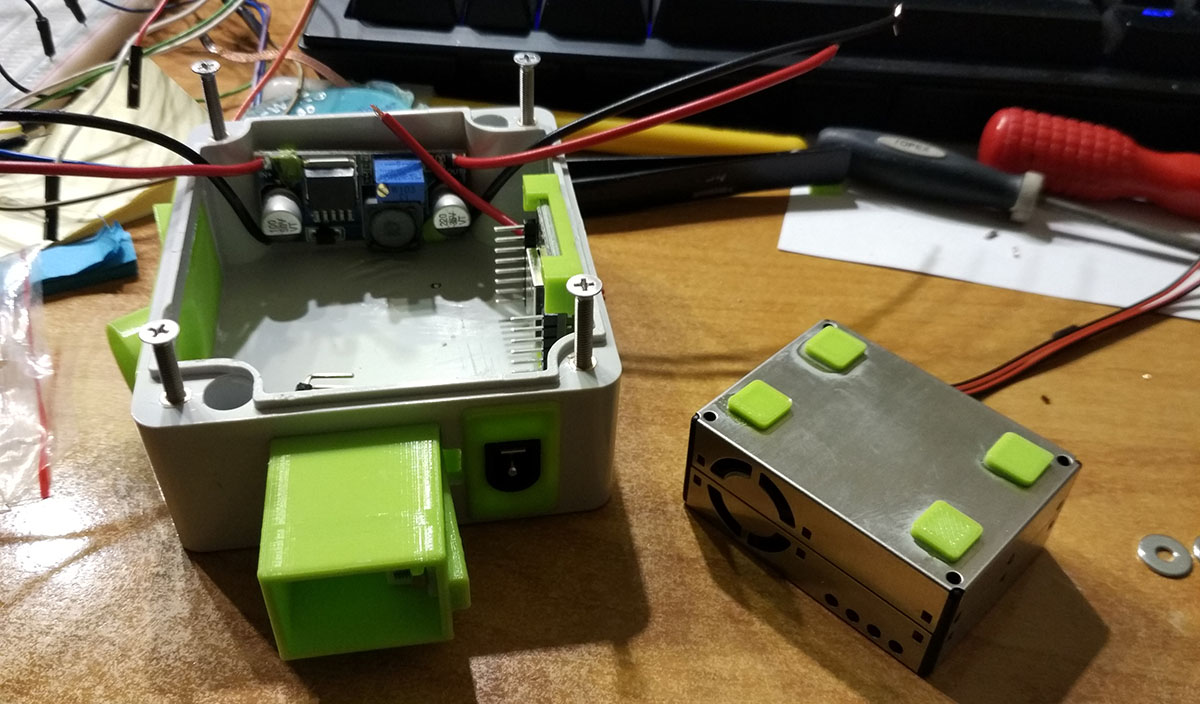
SmogWatch – Assembly in progress, pt. 1
Housing
I’ve decided to put the device into a Z54JS waterproof casing. I’ve also modeled and 3D printed additional elements: air quality sensor cover, “chimney” (or “tunnel”) for other sensors, as well as various mounting elements.
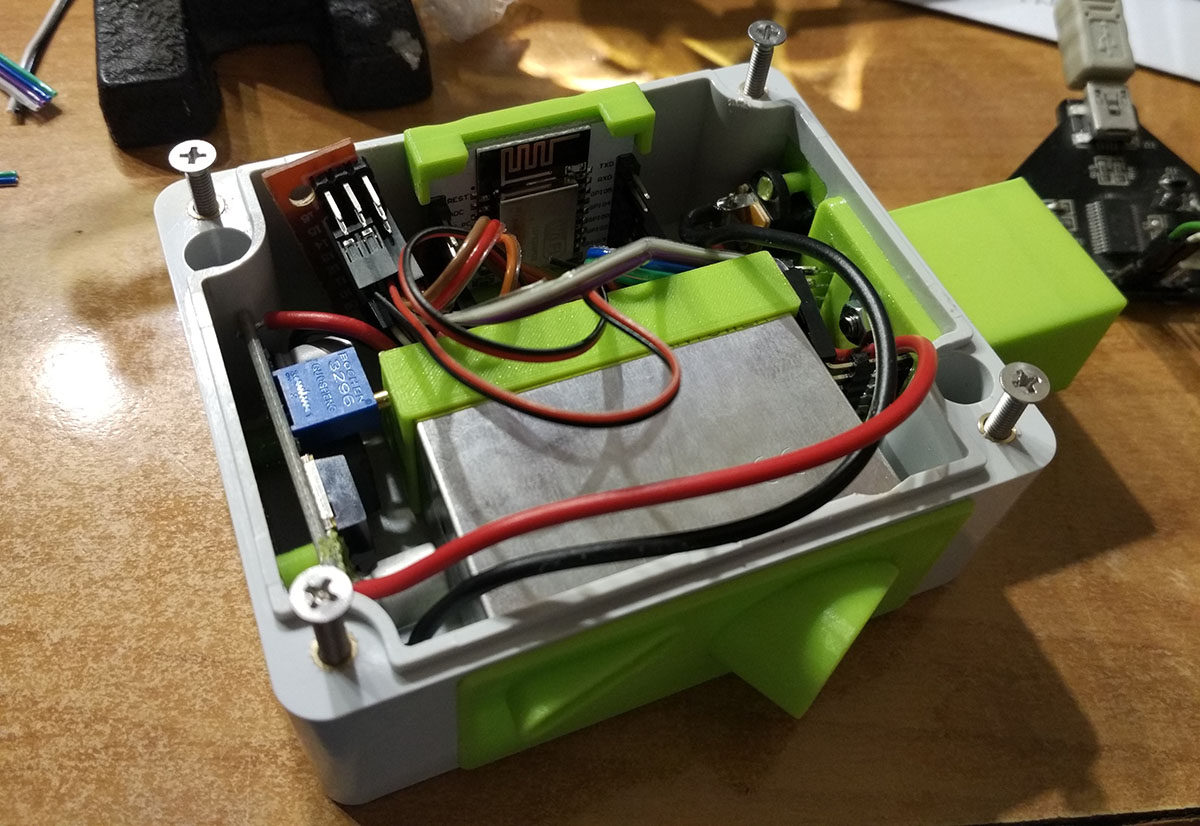
SmogWatch – Assembly in progress, pt. 2
Summary
I’ve managed to complete the project in almost the time I assumed at the beginning – in a little over two weekends. Of course, I have not worked non-stop. The device has been running for more than a month now and doesn’t cause any problems. The only doubt I have is the accuracy of the temperature measurement. I have the impression that they are slightly higher than they should be (about 2 or 3ºC). It is possible that this is caused by heat transfer from the device, because the sensor is placed relatively close to the rest of the device. I have to verify this when I have some free time. If anybody is interested, you can see the readings at http://powietrze.piotrsperka.info.
Source codes along with the project (Visual Studio Code with PlatformIO extension), as well as the schematic diagram and STL models can be found on my GitHub – here. Also if you have any questions, don’t hesitate to ask!